TSVdb
TCGA Splicing Variants DB
TSVdb is an easy-to-use web tool for integrating and visualizing mRNA alternative splicing, transcriptional isoform expression and clinical information from The Cancer Genome Atlas project (TCGA) RNA-Seq data.
Tutorial
1. Selecting the data
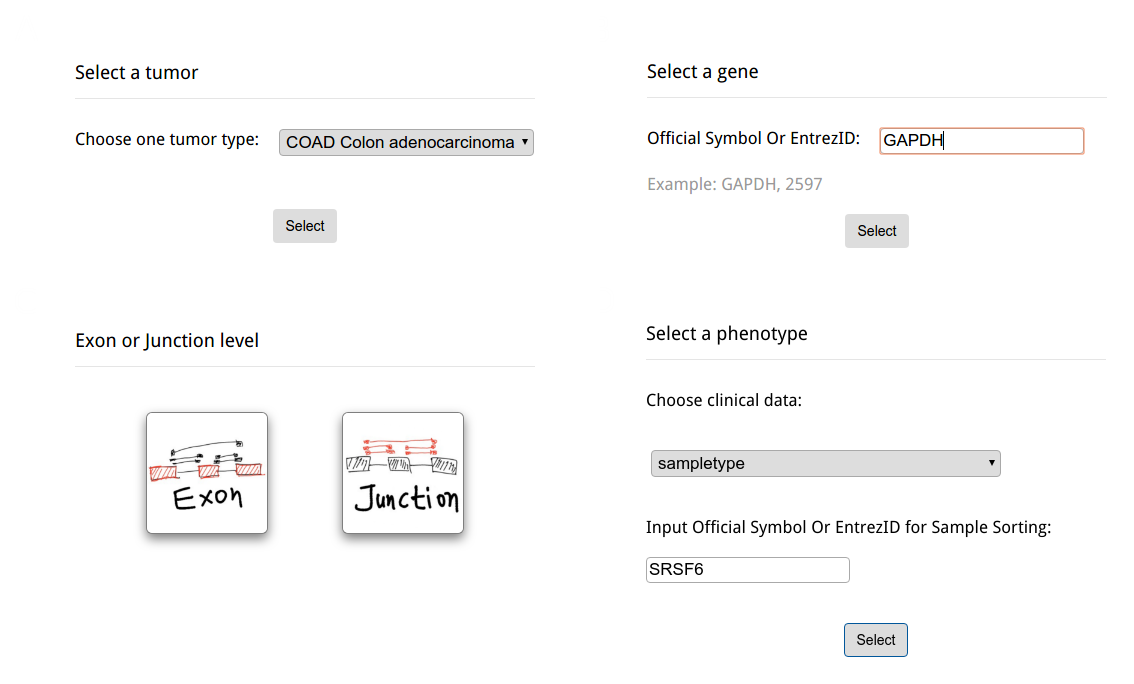
Upon opening the data visualization page, the user needs to sequentially choose the tumor type, gene, data type and clinical information. No other operations can be performed before choosing these options. Do not worry when making selections at this stage, as the options can be edited afterwards.
The first pop-up dialog (Fig. A) is the cancer type; please select the cancer type you are interested in and click the selection button. In the second pop-up dialog (Fig. B), please enter an Official Gene Symbol or Entrez ID. If the query does not exist, the alarm will appear and notify you. Then, choose the exon/junction usage value (Fig. C). The exon/junction usage is the scaled expression; for more information about the scaling method, please refer to the next section. Finally, choose the phenotype you are interested in and the gene expression data to sort the samples in each phenotype subgroup (Fig. D). The gene expression value can be set to another gene so that the correlation between alternative splicing for one gene and the expression of another gene can be investigated.
Tutorial
2. About the graph
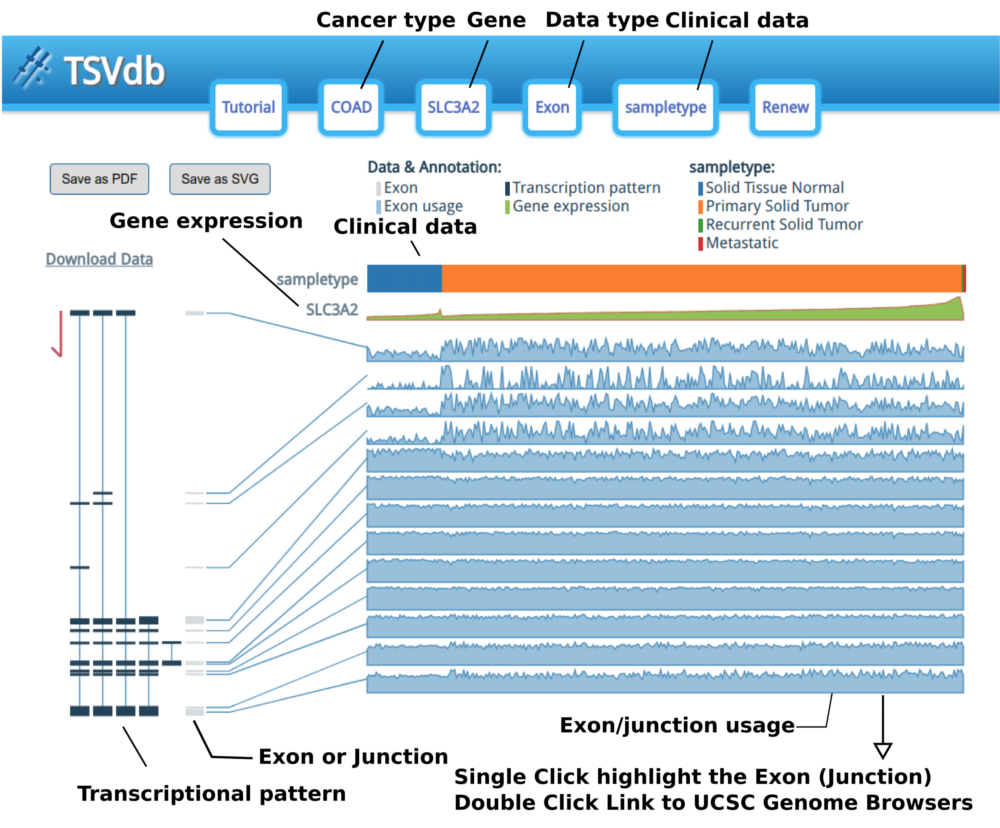
The options are in the header display; they can be edited by clicking the corresponding buttons in the header.
The samples are sorted by clinical type and then sorted by gene expression. When the mouse hovers over the clinical attribute row, the group name and a red line will appear.
The “Exon or Junction” gray boxes are the exons/junctions that TCGA uses to count the mapping reads in the TCGA Level 3 mRNA Seq datasets.
Each exon/junction usage value is shown as a shadowed line graph with the usage in the row and the samples in the columns. The exon/junction pattern will be transiently or permanently highlighted when the mouse hovers or clicks an exon/junction-shadowed line graph. Moreover, when you double click on an exon/junction-shadowed line, the UCSC Genome Browser will open in a new tab/window with the selected exon/junction area highlighted and let you examine the annotation in the UCSC Genome Browser.
Tutorial
3. Isoform expression
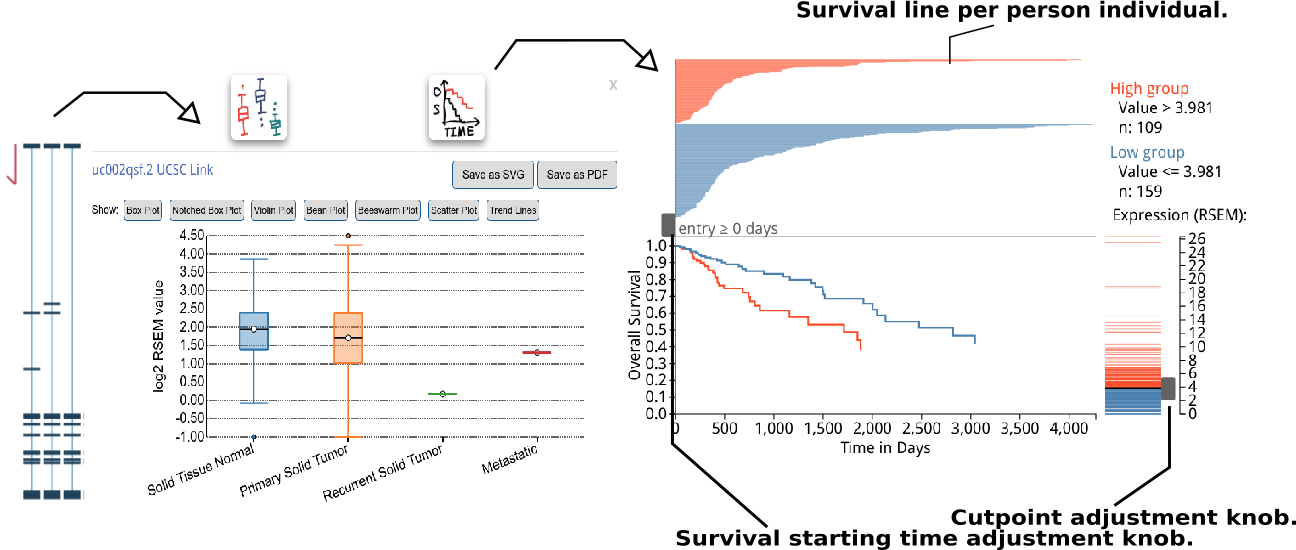
A box plot for isoform expression (normalized RSEM) will appear after clicking the transcriptional isoform graph. On the top right side, you can see the UCSC isoform ID. Clicking on this ID will open a new tab or window display for the highlighted isoform in the UCSC Genome Browser. The buttons at the top of the pop-up box are used to choose the box plot or KM survival plot to be displayed.
The KM survival curve has four parts. (1) In the bottom right, there is a way to adjust the cut-off for grouping; the knob can be adjusted to change the cut-off. The default value is the middle of the range. (2) The top right displays the information on the groups, including the cut-off value and sample size of each group. (3). The top left shows the survival line for each individual included after filtering from the survival start time point.
Tool-chains and algorithms
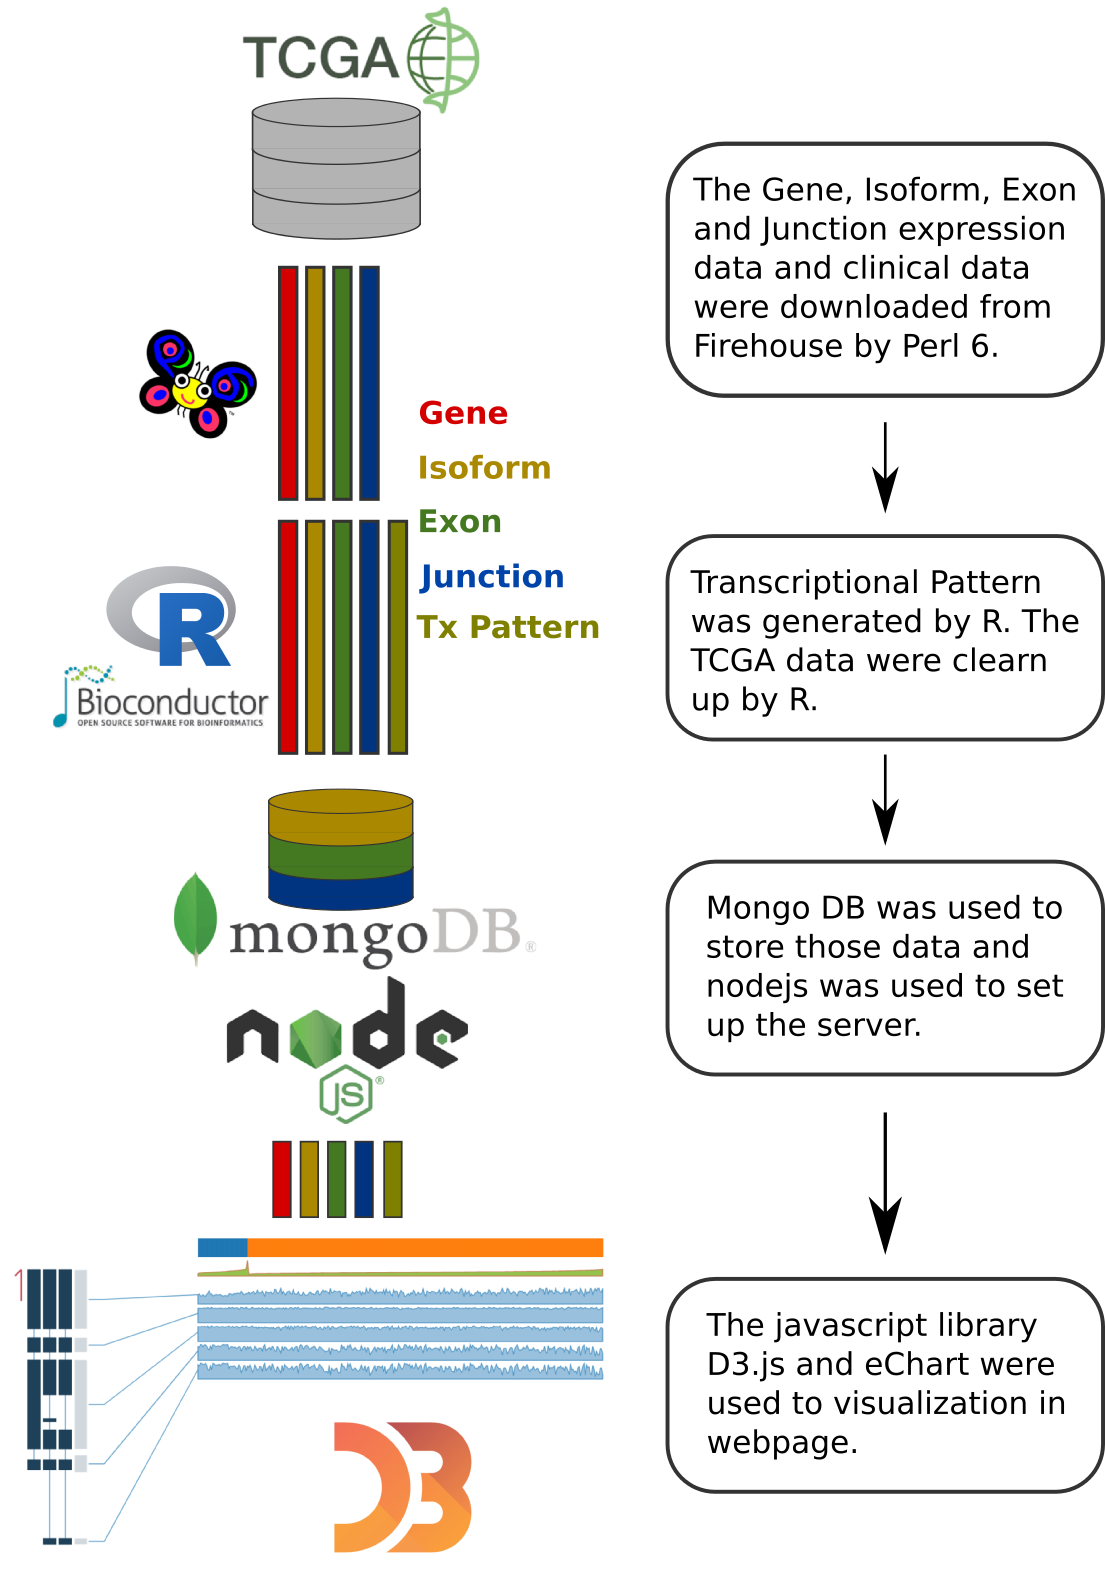
The TCGA level 3 gene, isoform, exon and junction normalized read count data (UNC illuminaHiSeq_RNASeqV2) and clinical data (Merged_clinical_level_1) were downloaded from the TCGA ftp site Firehose.
R was used to generate the transcriptional patterns and to perform the TCGA data cleanup. The formatted JSON data were import into MongoDB.
The exon/junction usage values were derived from exon/junction quantification. First, each sample's exon/junction quantification value was divided by the expression of the gene to which it belongs. Thus, the gene expression effect was removed and the AS event was highlighted. Next, the d3.js linear scale was used to map the normalized exon/junction value to the graph coordination. The exon/junction usage value interval (domain argument in the scale function) was set to 0 - Q95 (95\% quantile) to diminish the impact of outliers. If the value of Q95 was less than 0.05, the upper bound of the interval would be set to 0.05.